
Key Takeaways
- Size a can filling and seaming line from the required number of good cans, the real production window, and the demonstrated performance of every linked stage—not from the filler nameplate al…
- The calculations below are planning methods and hypothetical examples. They are not a capacity promise for a Zhejiang Weichi machine or for an untested can, product, plant layout, or downstr…
- “Can line capacity” can refer to very different scopes. One buyer may mean the filler-seamer monoblock. Another may mean the complete route from empty-can depalletizing to tray packing or pa…
Quick answer
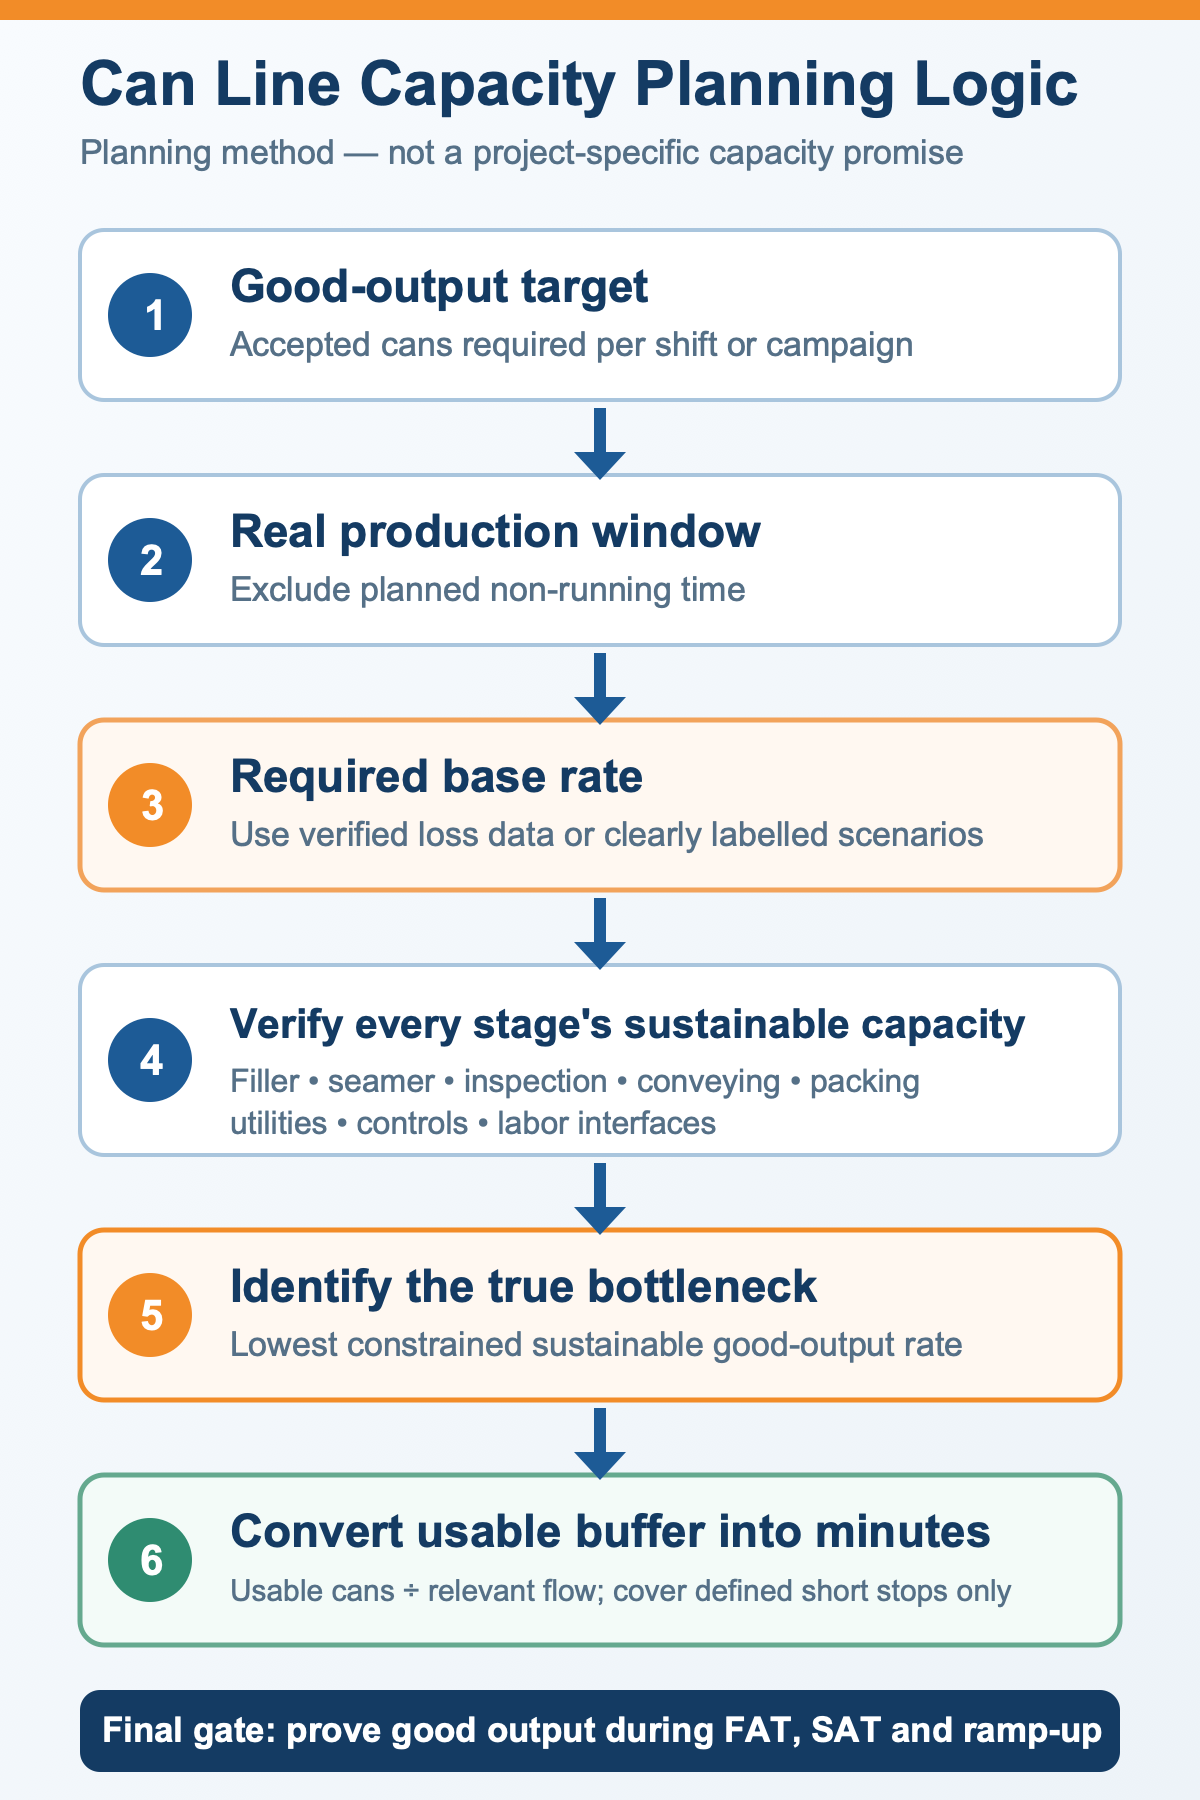
Size a can filling and seaming line from the required number of good cans, the real production window, and the demonstrated performance of every linked stage—not from the filler nameplate alone.
A defensible plan has four parts:
- Convert the order or shift target into good cans per minute.
- Apply a project-specific factor for availability, speed loss, and rejects, based on comparable operating data or clearly labelled scenarios.
- Check the sustainable capacity of the filler, seamer, conveyors, inspection, coding, packing, utilities, and labor interfaces. The lowest constrained stage is the line bottleneck.
- Express accumulation as usable cans and minutes of cover. A buffer absorbs defined short stops; it does not repair a permanently undersized machine.
The calculations below are planning methods and hypothetical examples. They are not a capacity promise for a Zhejiang Weichi machine or for an untested can, product, plant layout, or downstream package.
1. Define the line boundary before calculating capacity
“Can line capacity” can refer to very different scopes. One buyer may mean the filler-seamer monoblock. Another may mean the complete route from empty-can depalletizing to tray packing or palletizing. The same numerical rate cannot be compared until the boundary is written down.
For a complete-line study, identify at least:
- empty-can unloading, depalletizing, rinsing, or air conveying;
- product preparation, transfer, temperature, and pressure control;
- filling and lid feeding;
- seaming and discharge handling;
- fill-level, closure, leak, or vision inspection in the agreed scope;
- external drying, coding, and traceability;
- accumulation and conveyor interfaces;
- case, tray, shrink, or other secondary packaging;
- palletizing, utilities, cleaning, changeover, and operator tasks.
Also define the counting point. A filler discharge count is not the same as saleable cans after inspection and packing. For procurement planning, the target should normally be stated at the final agreed good-output point.
2. Convert the shift target into a base demand rate
Start with the number of acceptable cans required in the available production window:
Base demand rate (cans/min) = target good cans ÷ net planned production minutes
Net planned production minutes should exclude time that the project deliberately reserves for activities such as breaks, planned cleaning, product changeover, or scheduled maintenance. Record those exclusions instead of hiding them inside an efficiency percentage.
Do not confuse this base demand rate with the machine rate that must be specified. Real production also loses time to unplanned stops, reduced speed, and rejects.
3. Use verified loss data—or show scenarios
If comparable production data exist, availability, performance, and quality losses can be measured with a defined line boundary and time basis. Siemens describes Overall Equipment Effectiveness (OEE) as the product of availability, performance, and quality. That definition is useful only when the underlying states, ideal rate, rejects, and planned time are measured consistently.
For an early project without reliable data, do not insert a universal “industry OEE.” Use several labelled planning scenarios and replace them with measured values during FAT, SAT, and production ramp-up.
A simplified early-stage relationship is:
Required demonstrated rate = base demand rate ÷ combined planning factor
The combined planning factor is a project assumption representing the fraction of the planned window expected to become good output at the defined counting point. It must not be presented as a guaranteed OEE.
Worked example: from a shift target to a rate requirement
Assume, only for illustration:
- target good output: 120,000 cans per shift;
- shift length: 480 minutes;
- planned breaks, cleaning, and changeover excluded from production: 90 minutes;
- net planned production window: 390 minutes.
The base demand rate is 120,000 ÷ 390 = 307.7 good cans/min.
| Illustrative combined factor | Required demonstrated rate | Equivalent hourly rate |
|---|---|---|
| 0.75 | 410.3 cans/min | 24,615 cans/h |
| 0.82 | 375.2 cans/min | 22,514 cans/h |
| 0.90 | 341.9 cans/min | 20,513 cans/h |
These factors are sensitivity cases, not recommended values. The exercise shows why a buyer must disclose the time basis and expected losses. Selecting “a 20,000 cans/h machine” from the shift target alone would not satisfy this example under any of the three assumptions.
The final selection must also check whether every critical stage can sustain the required rate with the actual product, can and end, inspection rules, changeovers, utilities, and downstream packaging.
4. Build a stage-by-stage capacity table
List each stage with the same units and the same product condition. Separate catalogue or instantaneous speed from demonstrated sustainable speed and good output.
| Stage | Capacity evidence to request | Common constraint to verify |
|---|---|---|
| Empty-can infeed | Sustained delivery rate and starvation events | Depalletizer cycles, lane balance, damaged cans |
| Filler | Good fill count at the actual product condition | Foam, temperature, pressure, viscosity, fill tolerance |
| Seamer | Sustainable rate plus seam inspection by head | End feed, tooling, can/end variation, inspection stops |
| Inspection and coding | Detection, reject, and read-rate evidence at line speed | False rejects, unreadable codes, reject-bin handling |
| Secondary packaging | Pack pattern, changeover, and recovery performance | Tray/case supply, film or carton changes, pallet cycles |
| Utilities and labor | Consumption profile and staffing by operating state | Product supply, air, steam, water, cleaning, replenishment |
Use the lowest sustainable, quality-compliant rate as the provisional line constraint. Then check interactions: a fast filler can still spend time blocked by a packer, while the seamer can be starved by empty-can or lid supply.
5. Distinguish four different speed claims
- Nameplate or catalogue rate: a stated equipment rating under defined conditions.
- Instantaneous rate: the speed observed during a short stable interval.
- Sustainable rate: the rate maintained for the agreed test duration with recorded stops and conditions.
- Good-output rate: accepted cans at the defined downstream counting point after rejects.
These values answer different questions. A short speed display or raw filler counter does not by itself demonstrate shift output. Procurement documents should state which value is guaranteed, where it is counted, how long the run lasts, and what products, containers, changeovers, inspection rules, and exclusions apply.
6. Find the true bottleneck
The bottleneck is not always the machine with the smallest catalogue number. It is the resource that constrains good output under the agreed operating condition. The constraint may move when the product, can size, tray pattern, inspection plan, or changeover frequency changes.
For each SKU or format, compare:
- sustainable production rate;
- mean and longest relevant stop;
- restart and recovery behavior;
- reject rate and the point where rejects are counted;
- changeover duration and frequency;
- starved, running, blocked, held, stopped, and faulted time;
- operator and material-replenishment dependencies.
Consistent machine states and data tags make this comparison more reliable. OMAC’s PackML work provides common machine-state behavior and data concepts intended to make machines from different suppliers easier to integrate and monitor. A project does not need to claim PackML compliance to benefit from clearly specified state definitions and interface signals.
7. Size buffers in minutes, not only conveyor length
Accumulation protects linked machines from selected short interruptions. First define the event to be covered: for example, a brief tray replenishment, coder intervention, or a short downstream stop. Then calculate usable—not geometric maximum—capacity.
For a complete downstream stop:
Buffer cover time (min) = usable accumulation (cans) ÷ upstream inflow rate (cans/min)
For an upstream stop while downstream continues:
Buffer supply time (min) = usable accumulation (cans) ÷ downstream consumption rate (cans/min)
Example: if usable accumulation is 750 cans and the relevant flow is 375 cans/min, the theoretical cover is 2.0 minutes. That result must still be checked against conveyor geometry, minimum and maximum fill levels, pressure on containers, control response, sanitation, changeover clearing, and restart behavior.
Do not use buffer capacity to conceal a persistent rate mismatch. If a downstream packer continuously averages less than the required good-output rate, accumulation will eventually fill no matter how long the conveyor is.
8. Specify interfaces, controls, and recovery logic
Mechanical capacity is only part of line performance. The purchase specification should define:
- upstream and downstream ready, run, hold, blocked, starved, fault, and emergency-stop interfaces;
- speed-reference ownership and permitted speed ranges;
- product and container tracking across reject points;
- what happens to filled but unseamed cans during a stop;
- automatic restart, manual intervention, and controlled emptying rules;
- data counters, timestamps, stop reasons, and reporting boundaries;
- safe access, cleaning, drainage, and changeover requirements.
A line can contain individually capable machines and still underperform if their signals, stop logic, speeds, or recovery sequences are not coordinated.
9. Prove capacity during FAT, SAT, and ramp-up
Capacity should be tied to a written acceptance protocol. Before the test, agree on:
- the exact can body, end, product or approved test medium, fill condition, and pack format;
- the test boundary and good-output counting point;
- target rate, run duration, startup allowance, planned interventions, and exclusions;
- which machine states and stop reasons will be recorded;
- fill, seam, code, inspection, reject, and package-quality criteria;
- sampling by seaming head or station where required;
- how blocked/starved time, short stops, and restarts are evaluated;
- the disposition of deviations and the conditions for retest.
FAT can verify the agreed factory test setup. SAT confirms performance after installation with the actual plant utilities, layout, interfaces, and operating team. Neither should be described as proof for untested products, containers, or future changeovers.
Procurement checklist
To request a defensible line proposal, provide:
- good cans required per hour, shift, day, and product campaign;
- shift calendar and planned non-production time;
- product type, temperature, carbonation, viscosity, particles, foam, and cleaning conditions;
- can and end drawings, revisions, samples, and approved seam specification;
- every intended SKU and changeover frequency;
- inspection, coding, reject, secondary-pack, and pallet requirements;
- available layout, conveyor elevations, utilities, and labor assumptions;
- comparable loss data or the scenario factors to be evaluated;
- required buffer events and cover time;
- FAT, SAT, data, documentation, and acceptance requirements.
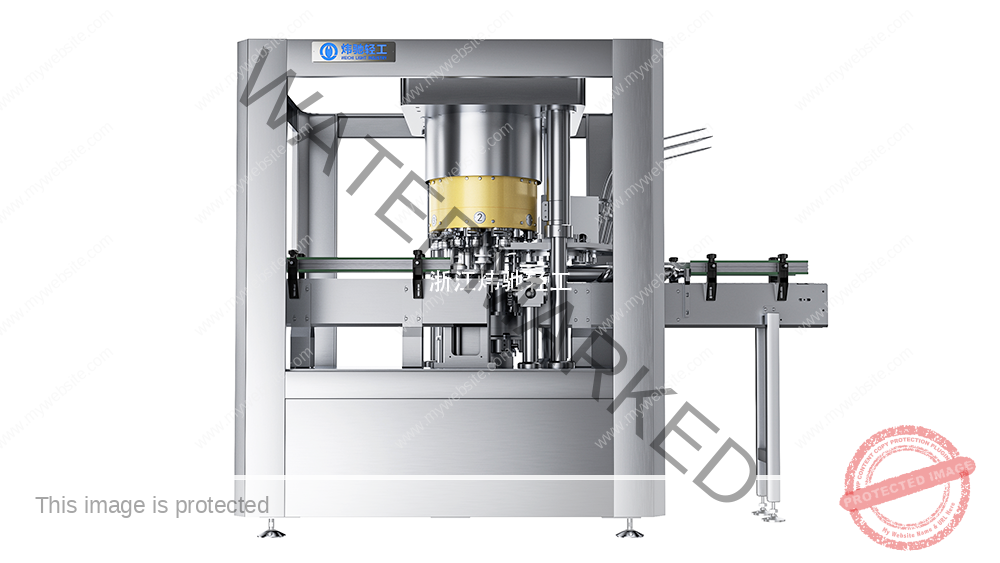
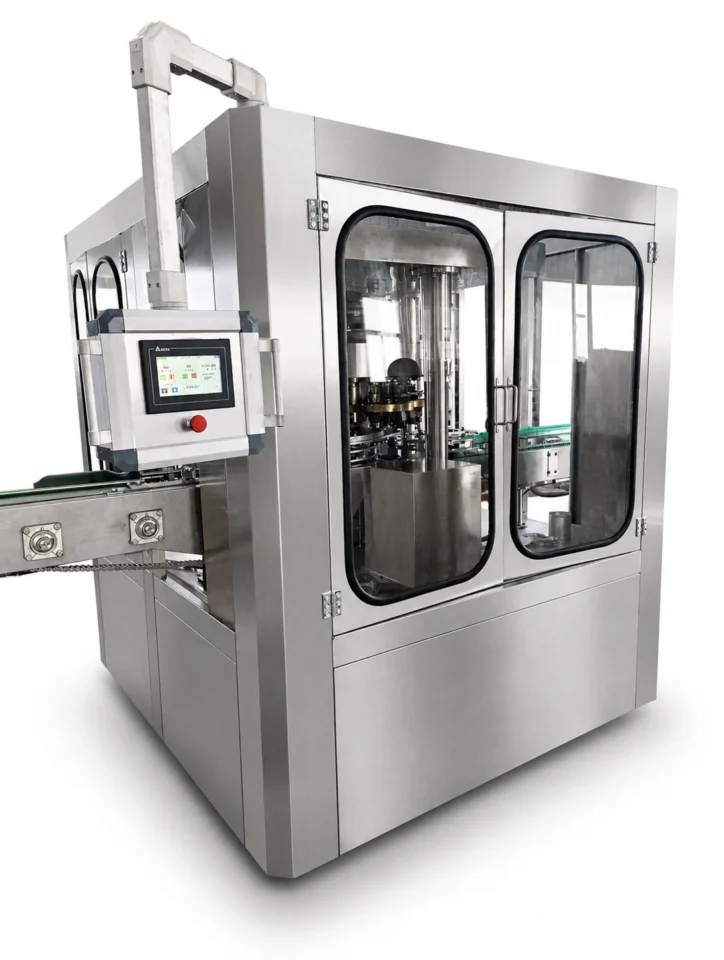
Zhejiang Weichi can review these inputs against the relevant equipment families and line interfaces. For an initial process shortlist, see the still beverage can filler-seamer and carbonated and beer can filler-seamer pages. The can and lid sample requirements guide explains the packaging data needed before compatibility is confirmed.
Final capacity, utilities, layout, change parts, controls, and acceptance conditions must be confirmed in the project-specific technical documents and tests. To prepare that review, use the contact page and include the target good output, product, can/end, shift window, and downstream pack format.
Frequently asked questions
Should the filler be the fastest machine in the line?
Not automatically. Each stage needs enough demonstrated capacity and recovery margin for the agreed operating strategy. Oversizing one machine without checking the seamer, inspection, conveyors, packer, utilities, and controls may add cost without increasing good output.
Is 10% spare capacity always enough?
No universal percentage is defensible. Required margin depends on verified loss data, SKU mix, changeovers, stop distribution, recovery behavior, future demand, maintenance strategy, and the commercial consequence of missing output.
Can OEE be copied from another factory?
It can be used only as an explicitly labelled scenario. A capacity commitment should use definitions and evidence matched to the actual boundary, time basis, product, container, crew, and line configuration.
How much accumulation is enough?
Define the interruption to be covered, then convert usable cans into minutes at the relevant flow. Verify the result with control response, physical conveyor behavior, container stability, sanitation, and restart tests.
What is the most important acceptance number?
The number of accepted cans at the agreed downstream counting point during a defined test window, together with recorded stops, rejects, product conditions, and quality results. A speed display alone is not enough.
Conclusion
A reliable can filling and seaming line plan begins with good-output demand and a documented production window. It then checks comparable loss evidence, the sustainable capacity of every stage, the location of the bottleneck, and the number of minutes that usable accumulation can protect.
The calculation is only the beginning. The procurement specification and FAT/SAT protocol must preserve the same boundary, product, packaging, counting point, and acceptance rules. That is how a capacity target becomes testable engineering evidence instead of a catalogue-speed assumption.
Technical references
Technical Basis and Project Evidence
Final equipment selection and acceptance must use the project product, can and end drawings, utility conditions, line interfaces, agreed test duration, and documented FAT/SAT criteria. Can and end supplier specifications remain authoritative for double-seam limits.
- U.S. FDA: Low-Acid Canned Food Manufacturers, Part 3 — Containers and Closures
- SAMR record: GB/T 30639-2014 — Sauce filling and seaming equipment
- SAMR record: GB/T 40360-2021 — Still-beverage can filling and seaming equipment
Review equipment families See project references Submit application data